

















The back-office dashboard
The settings open on the Dashboard, the home of the module. It shows at a glance that the module is running, how saved baskets are performing, and it is the gateway to every other screen through the coloured menu on the left.
The shell and the menu
The left menu lists the seven screens, in order: Dashboard, General, Cart expiration, Features, Statistics, Help and setup and Our modules. Clicking a name opens that screen without leaving the page.
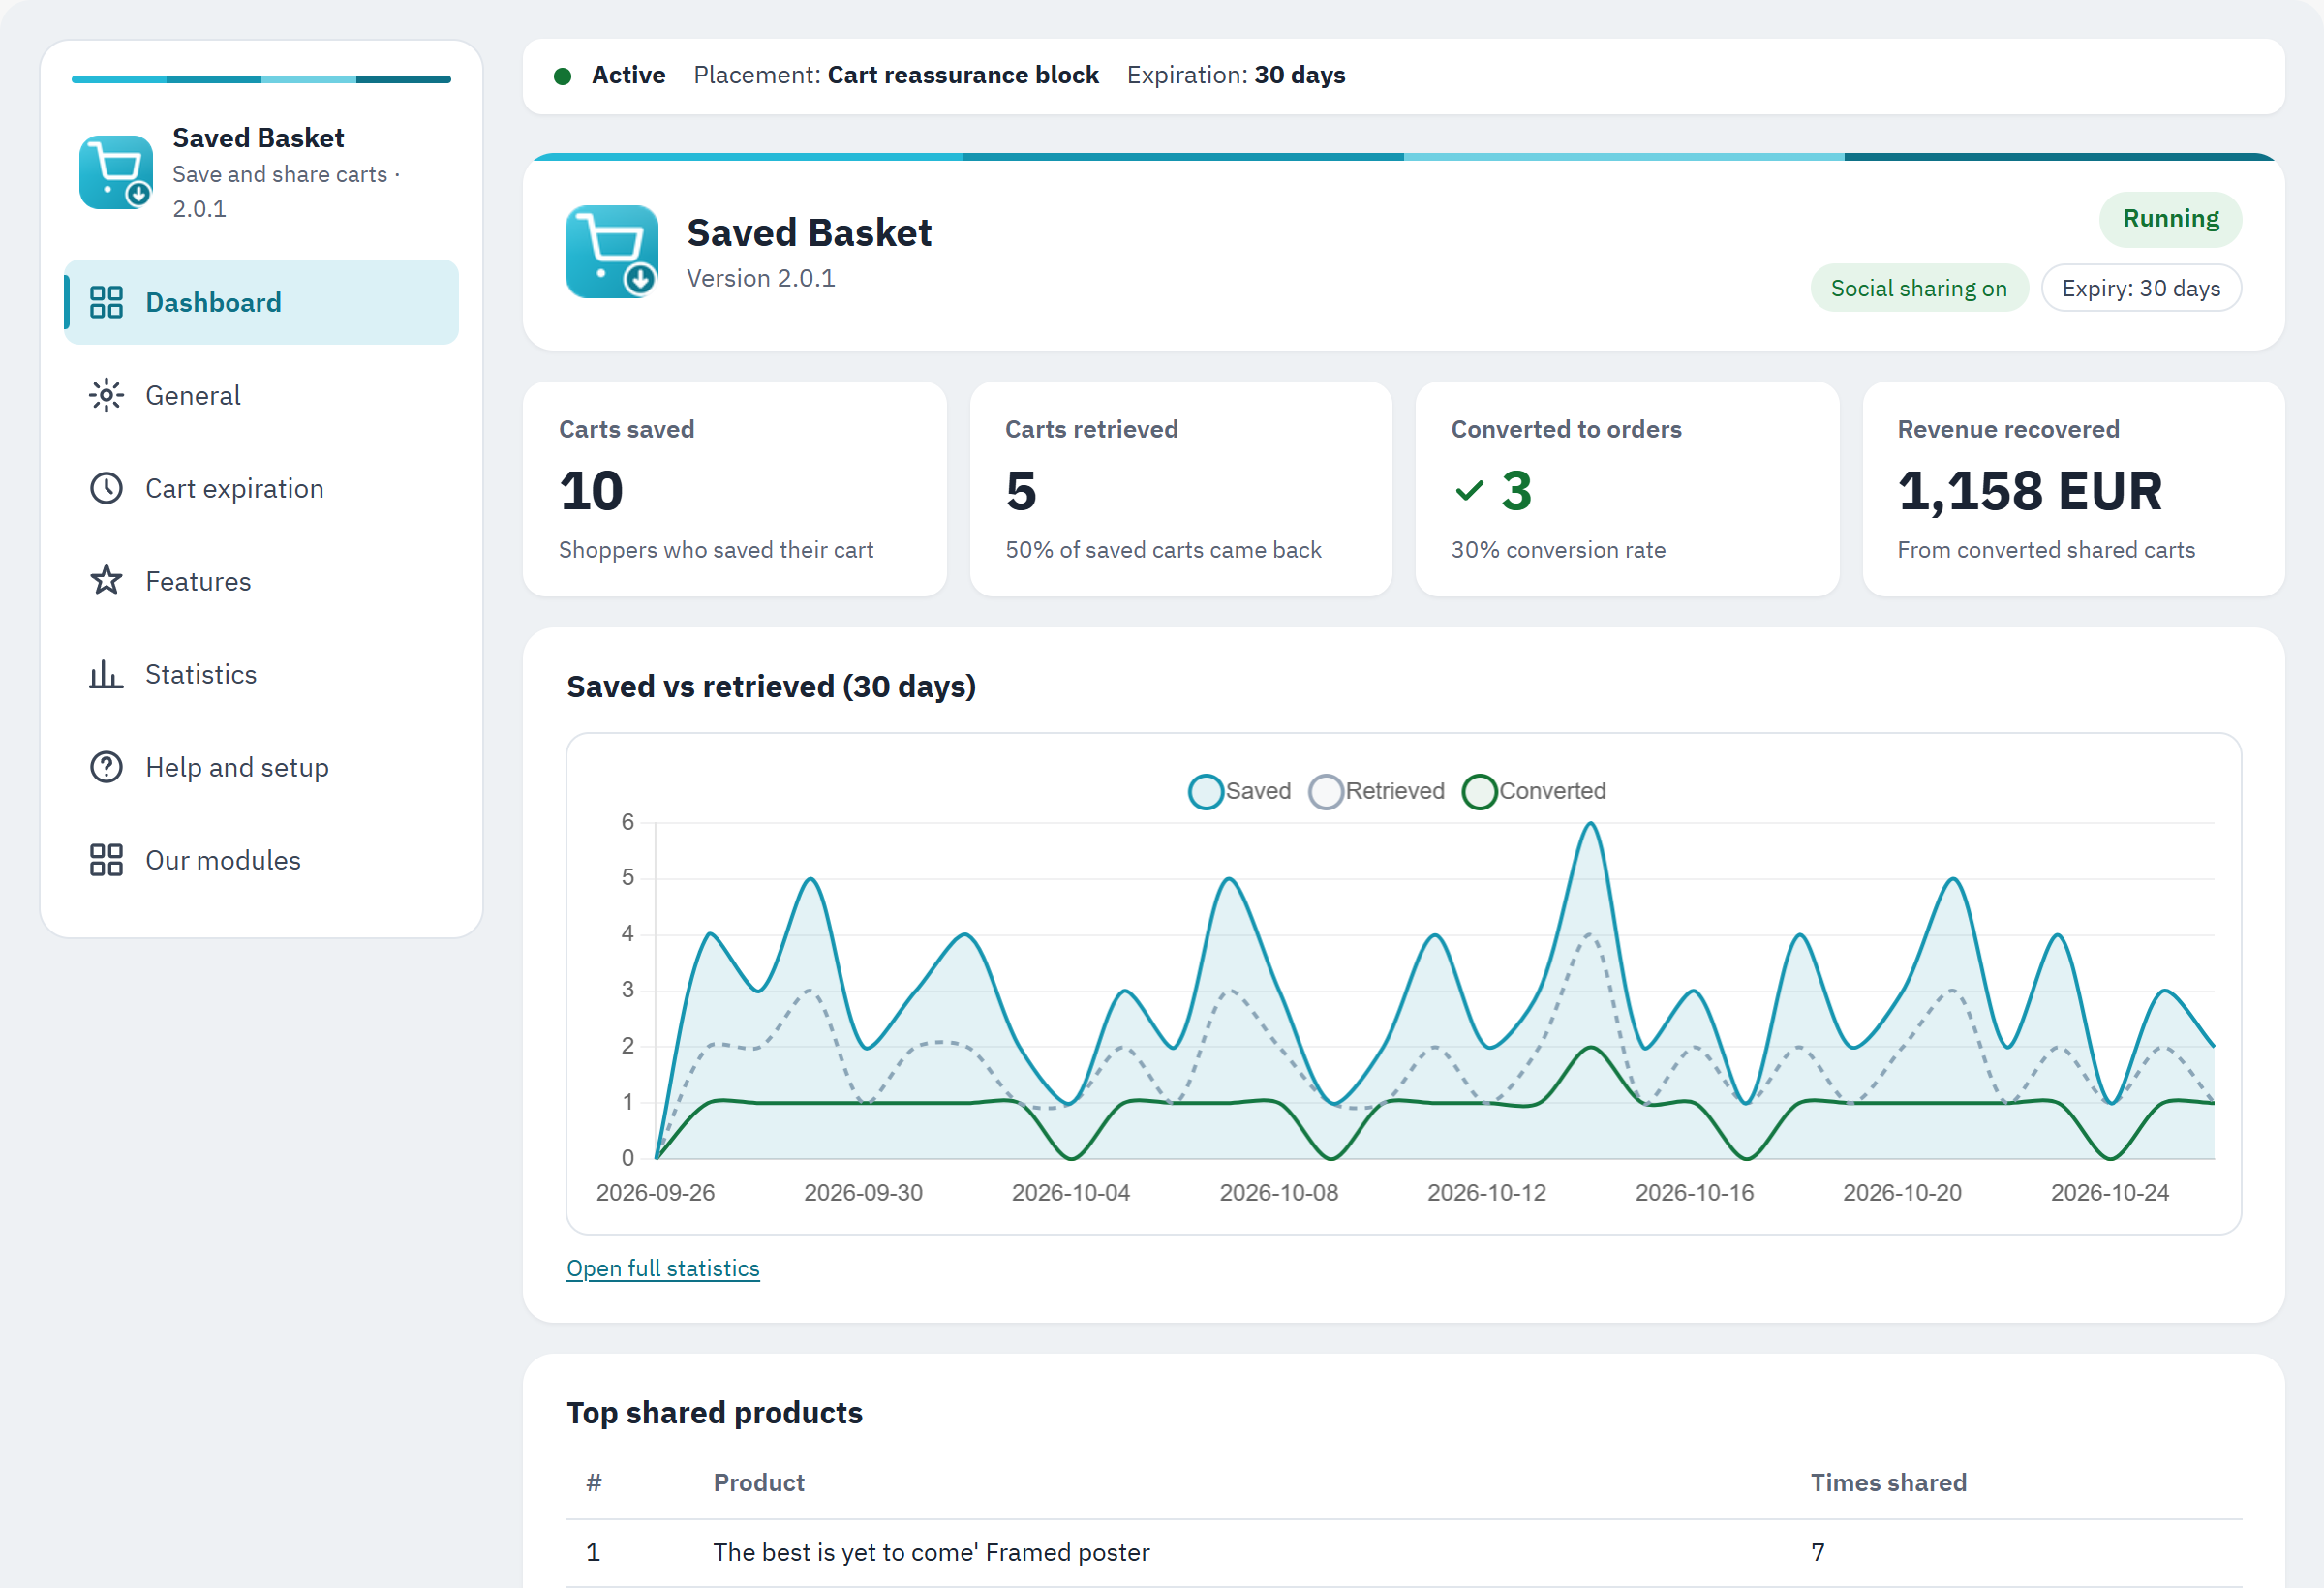
- The module name, its short tagline and version.
- The menu: one entry per screen.
- The status line: whether the module is Active, where the block is placed and the expiration setting.
- The dashboard header, with the running state and the feature chips.
The key figures
Four tiles summarise how saved baskets are doing. They are built from your own data and each one opens the full Statistics screen (Statistics).
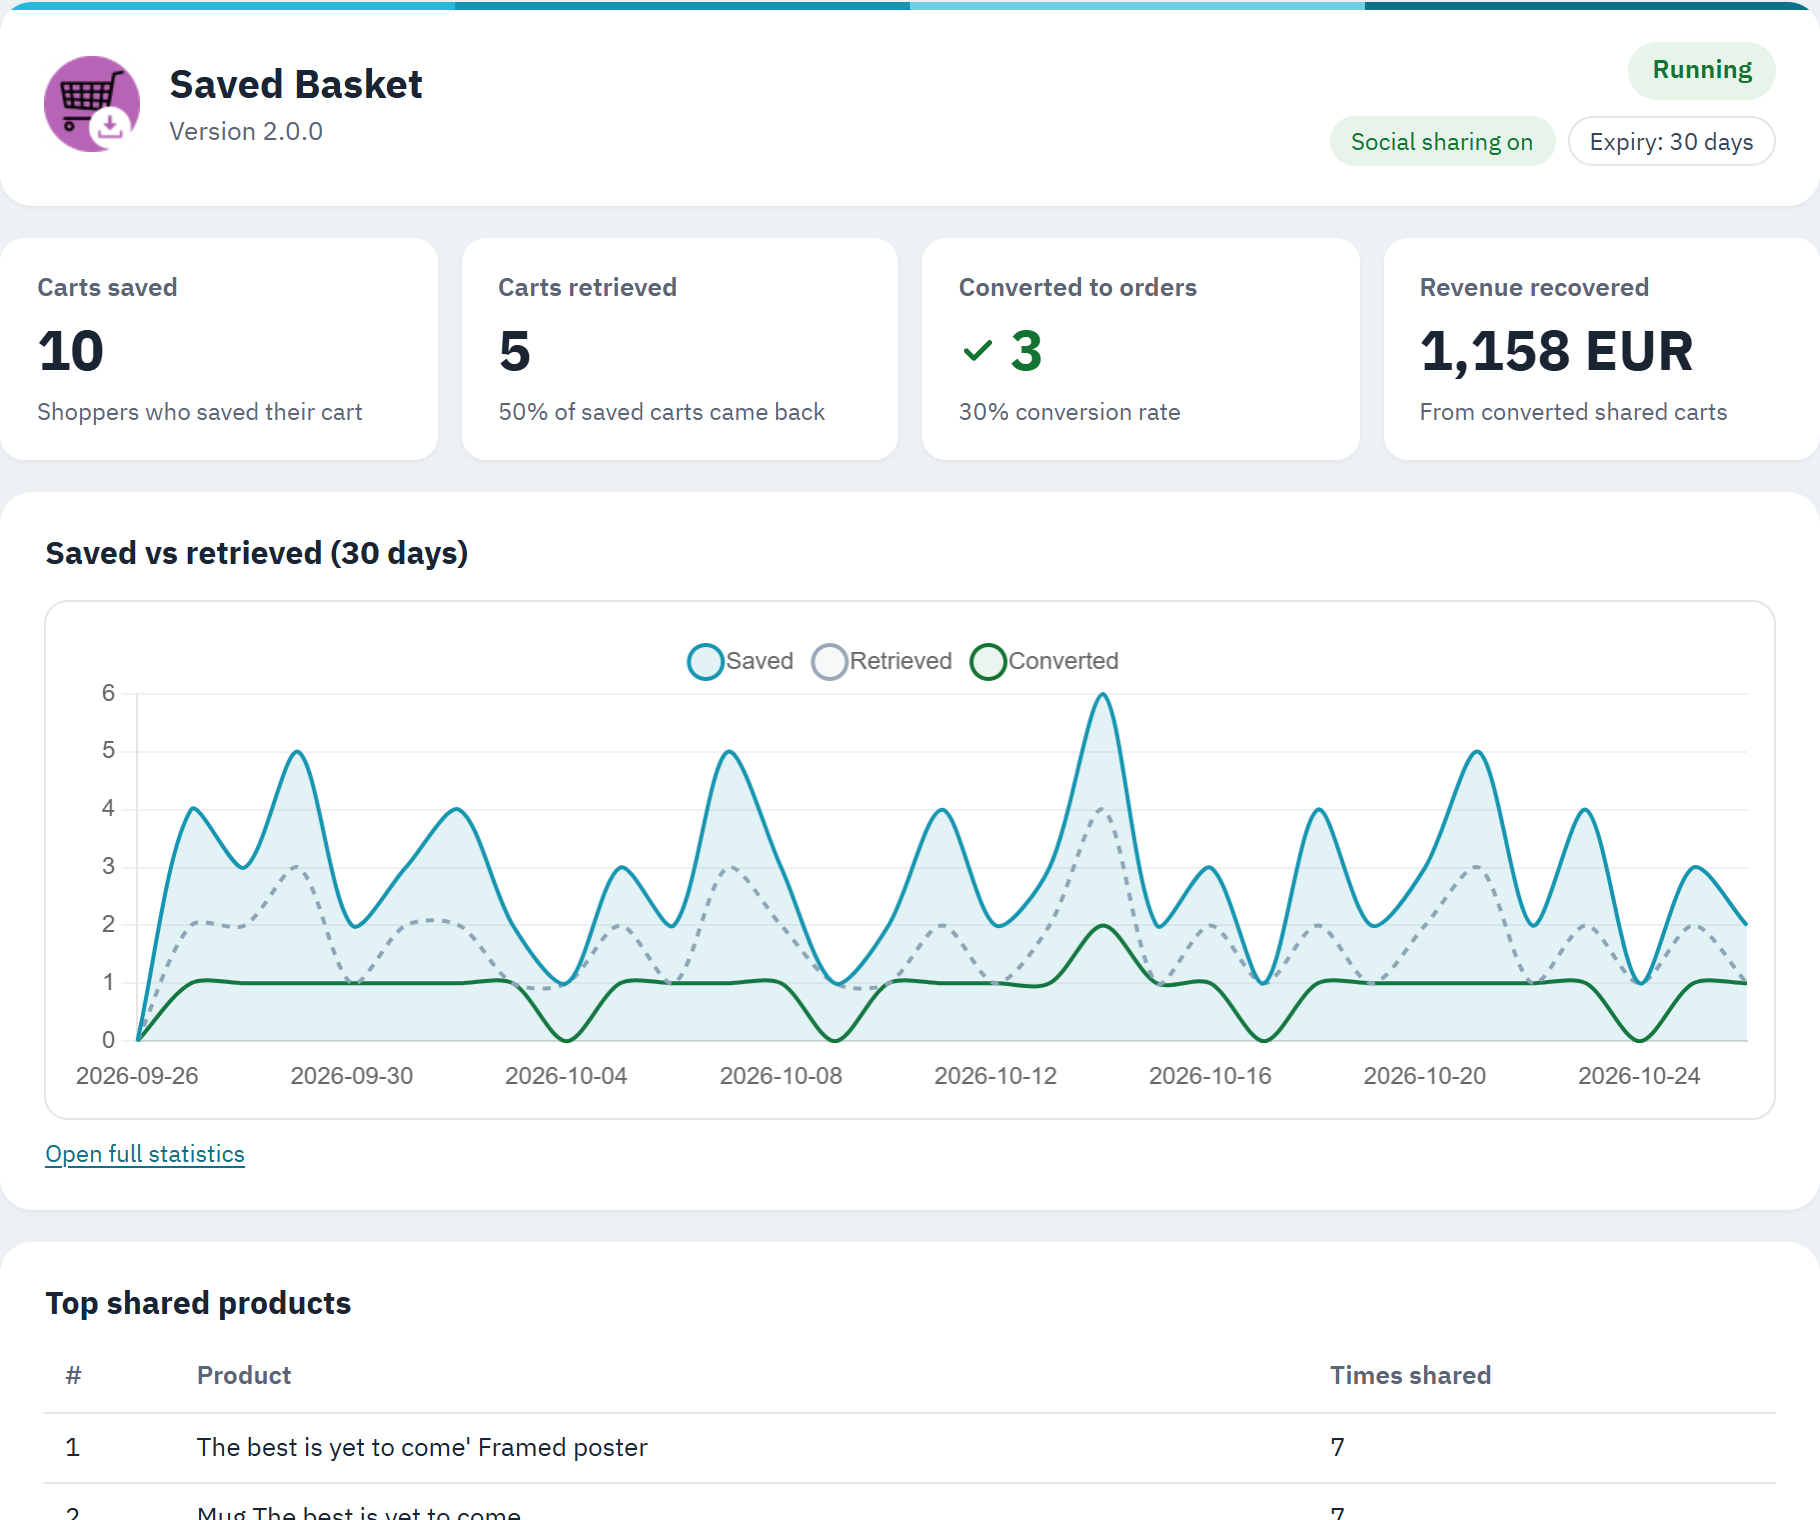
- The module's name, logo and version.
- The running state and the feature chips (social sharing, expiry).
- The tiles: Carts saved, Carts retrieved, Converted to orders and Revenue recovered.
- The saved-vs-retrieved chart for the last 30 days.
| Carts saved | How many baskets shoppers have saved. |
|---|---|
| Carts retrieved | How many times saved baskets were brought back, and the share of saved baskets that came back. |
| Converted to orders | How many retrieved baskets became orders, and the conversion rate. |
| Revenue recovered | The total value of the orders that came from saved baskets. |
The chart and the top products
Below the tiles, a chart plots saved, retrieved and converted baskets over the last 30 days, so you can see trends at a glance. Under it, the Top shared products list shows which products appear most often in saved baskets. For a longer period and the CSV export, open Statistics (Statistics).
Statistics
The Statistics screen is the full version of the dashboard figures: the saved, retrieved and converted trend over the period you choose, a CSV export, and the products that are shared most.
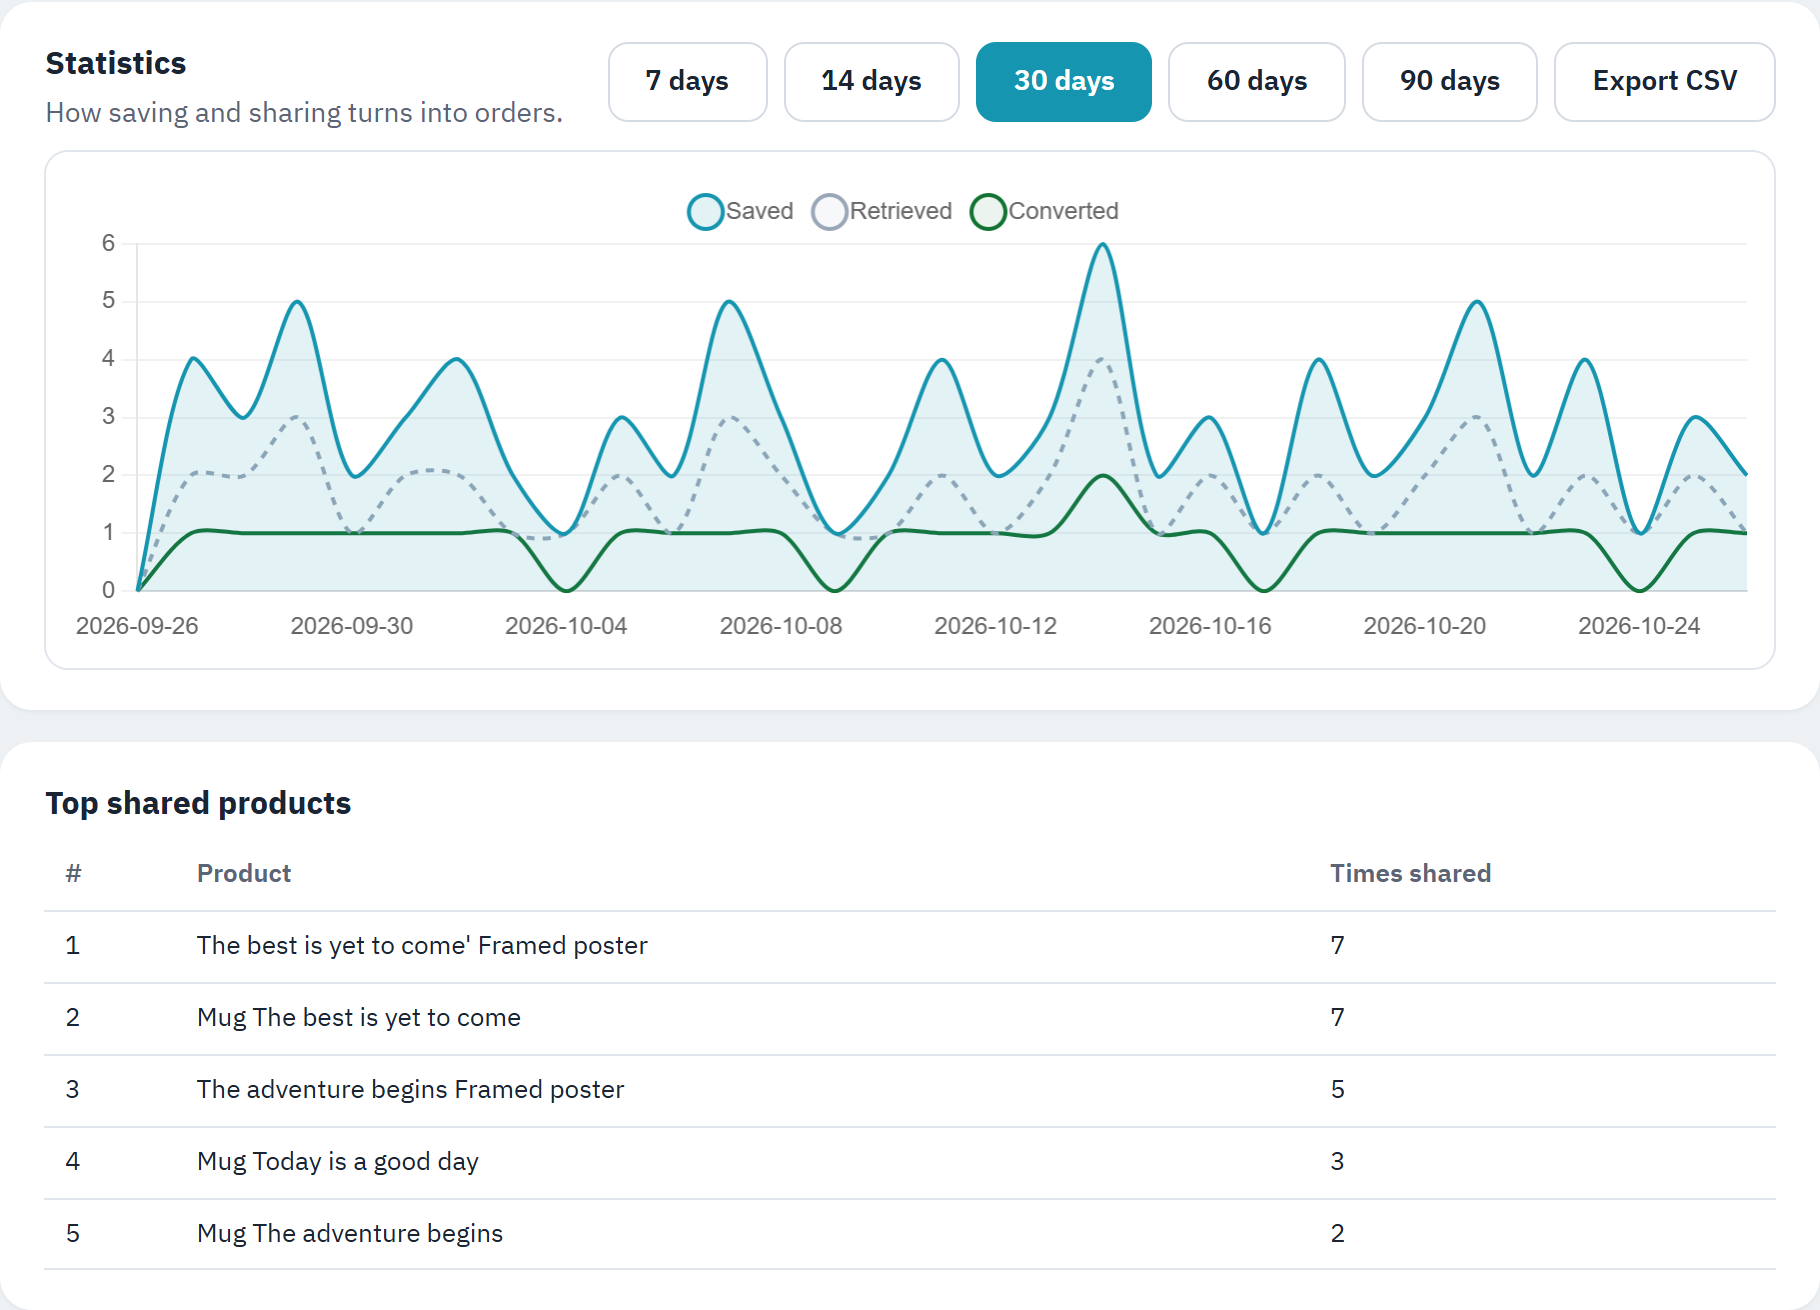
- The period buttons: 7, 14, 30, 60 or 90 days.
- Export CSV downloads the daily figures.
- The chart: saved, retrieved and converted baskets per day.
- The Top shared products list.
The chart and the period
The chart plots three lines over the chosen period: baskets Saved, baskets Retrieved and baskets Converted to orders. Pick the period with the buttons at the top, from 7 up to 90 days.
Export to CSV
Export CSV downloads the daily figures for the selected period as a spreadsheet file, with one row per day: the date, carts saved, carts retrieved and carts converted. Use it to keep a record, since uninstalling the module removes its data (Uninstall cleanly), or to analyse the numbers in your own tools.
Top shared products
The Top shared products list ranks the products that appear most often in saved baskets, with how many times each was shared. It is a quick way to see which products shoppers are most likely to come back for.